Published by
Gold Expert
in
Daily / Weekly Gold commentary
Gold's everlasting value as a reliable asset and geopolitical tool keeps it at the center of the global economy. Nations with significant gold reserves wield influence beyond regional development, impacting international trade and diplomacy.
In 2023, China emerged as the top gold producer, followed by Australia, Russia, Canada, and the United States. In line with current economic and cultural trends worldwide, gold demand is primarily driven by four sectors: jewelry, investment, central bank reserves, and technological applications.
The price of gold has generally increased over the past ten years owing to a complex interplay of supply and demand, geopolitical events, and economic shifts.
Meanwhile, production and market dynamics are heavily governed by major mining corporations like Newmont, Barrick Gold, and Agnico Eagle, whose global operations span multiple continents.
What Makes Gold a Reliable Form of Currency?
Gold has been a cornerstone of human civilization for centuries, not just as a symbol of wealth but also for its deep cultural significance and vital role in modern technology.
From the 17th to late 19th centuries, most currencies were backed by gold. Paper money and coins were essentially receipts for physical gold, and international trade often relied on gold for settlement. This meant countries needed stockpiles of this precious metal. Though most nations transitioned away from the gold standard by the mid-20th century, countries still hold significant gold reserves as a hedge against economic turmoil.
Today, gold is considered a “safe haven” asset for its reliability and store of value. This investment offers capital preservation and diversification because of gold’s stability, durability, and global acceptance.
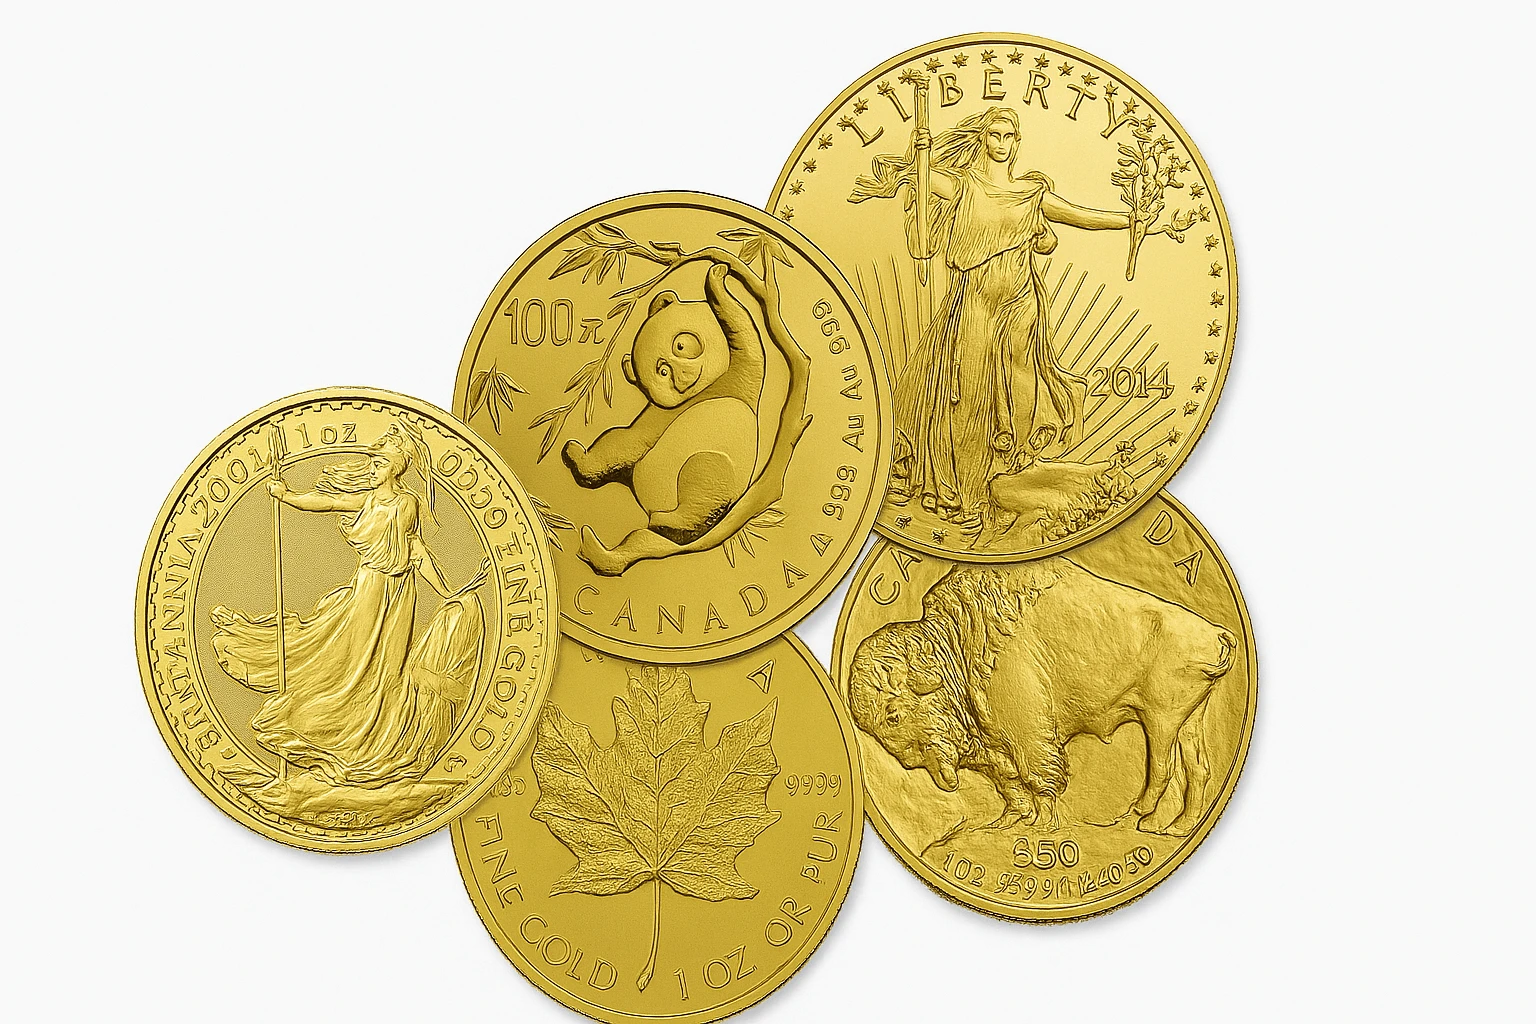
Besides, gold has fascinated humanity for millennia. Its intrinsic value and luster make it a symbol of wealth, stability, and prosperity. In many cultures and religions, gold is associated with purity, enlightenment, and wisdom.
Its malleability allows for intricate jewelry designs while remaining strong and durable. The use of gold is also crucial in electronic components due to its excellent conductivity and resistance to corrosion.
This article aims to provide an in-depth analysis of the current state of the global gold industry, focusing on key statistics and trends that shape the market today.
Key Findings
Largest Mine Reserves:
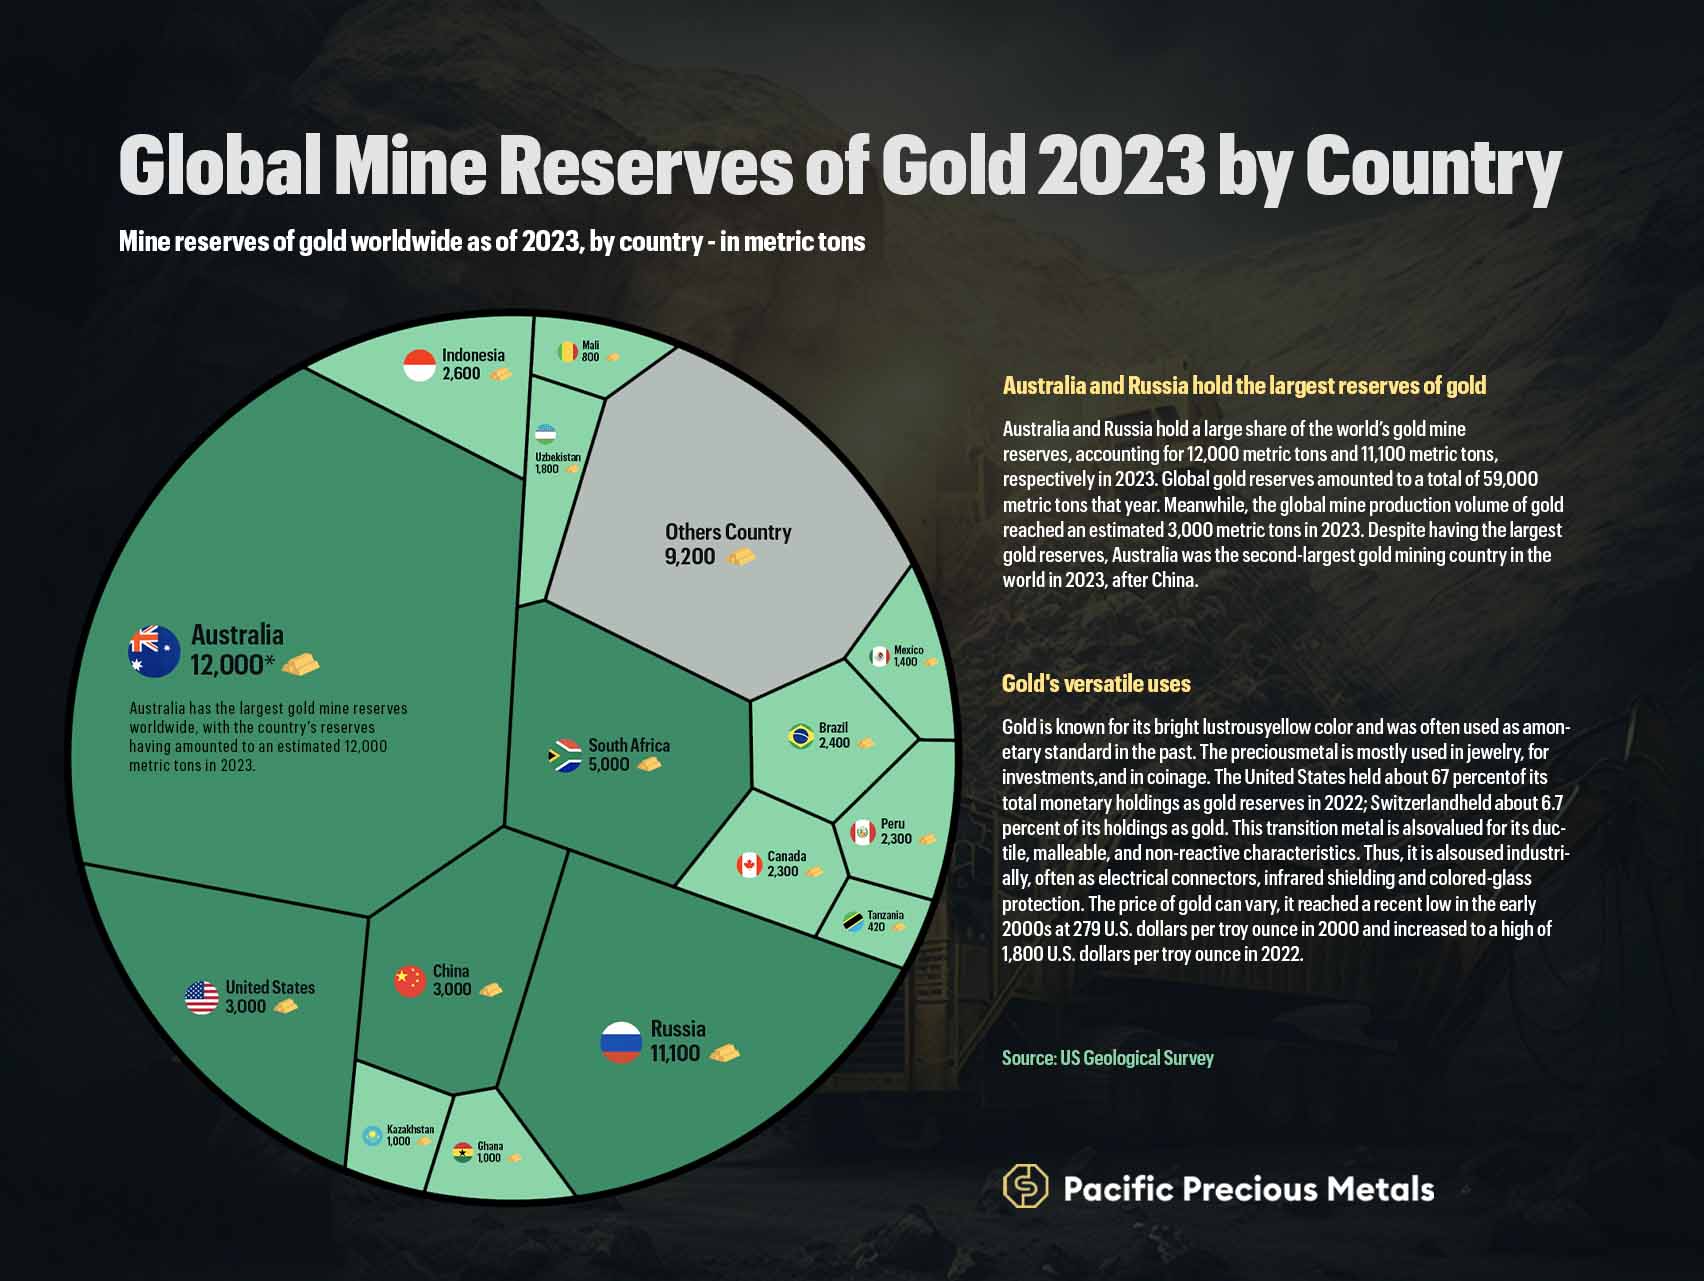
- Australia has the world's largest gold mine reserves, at 12,000 metric tons. Russia follows closely with 11,100 metric tons.
- South Africa, the United States, and China also have substantial reserves, with 5,000, 3,000, and 3,000 metric tons, respectively. Collectively, other countries hold 9,200 metric tons.
Rising Prices:
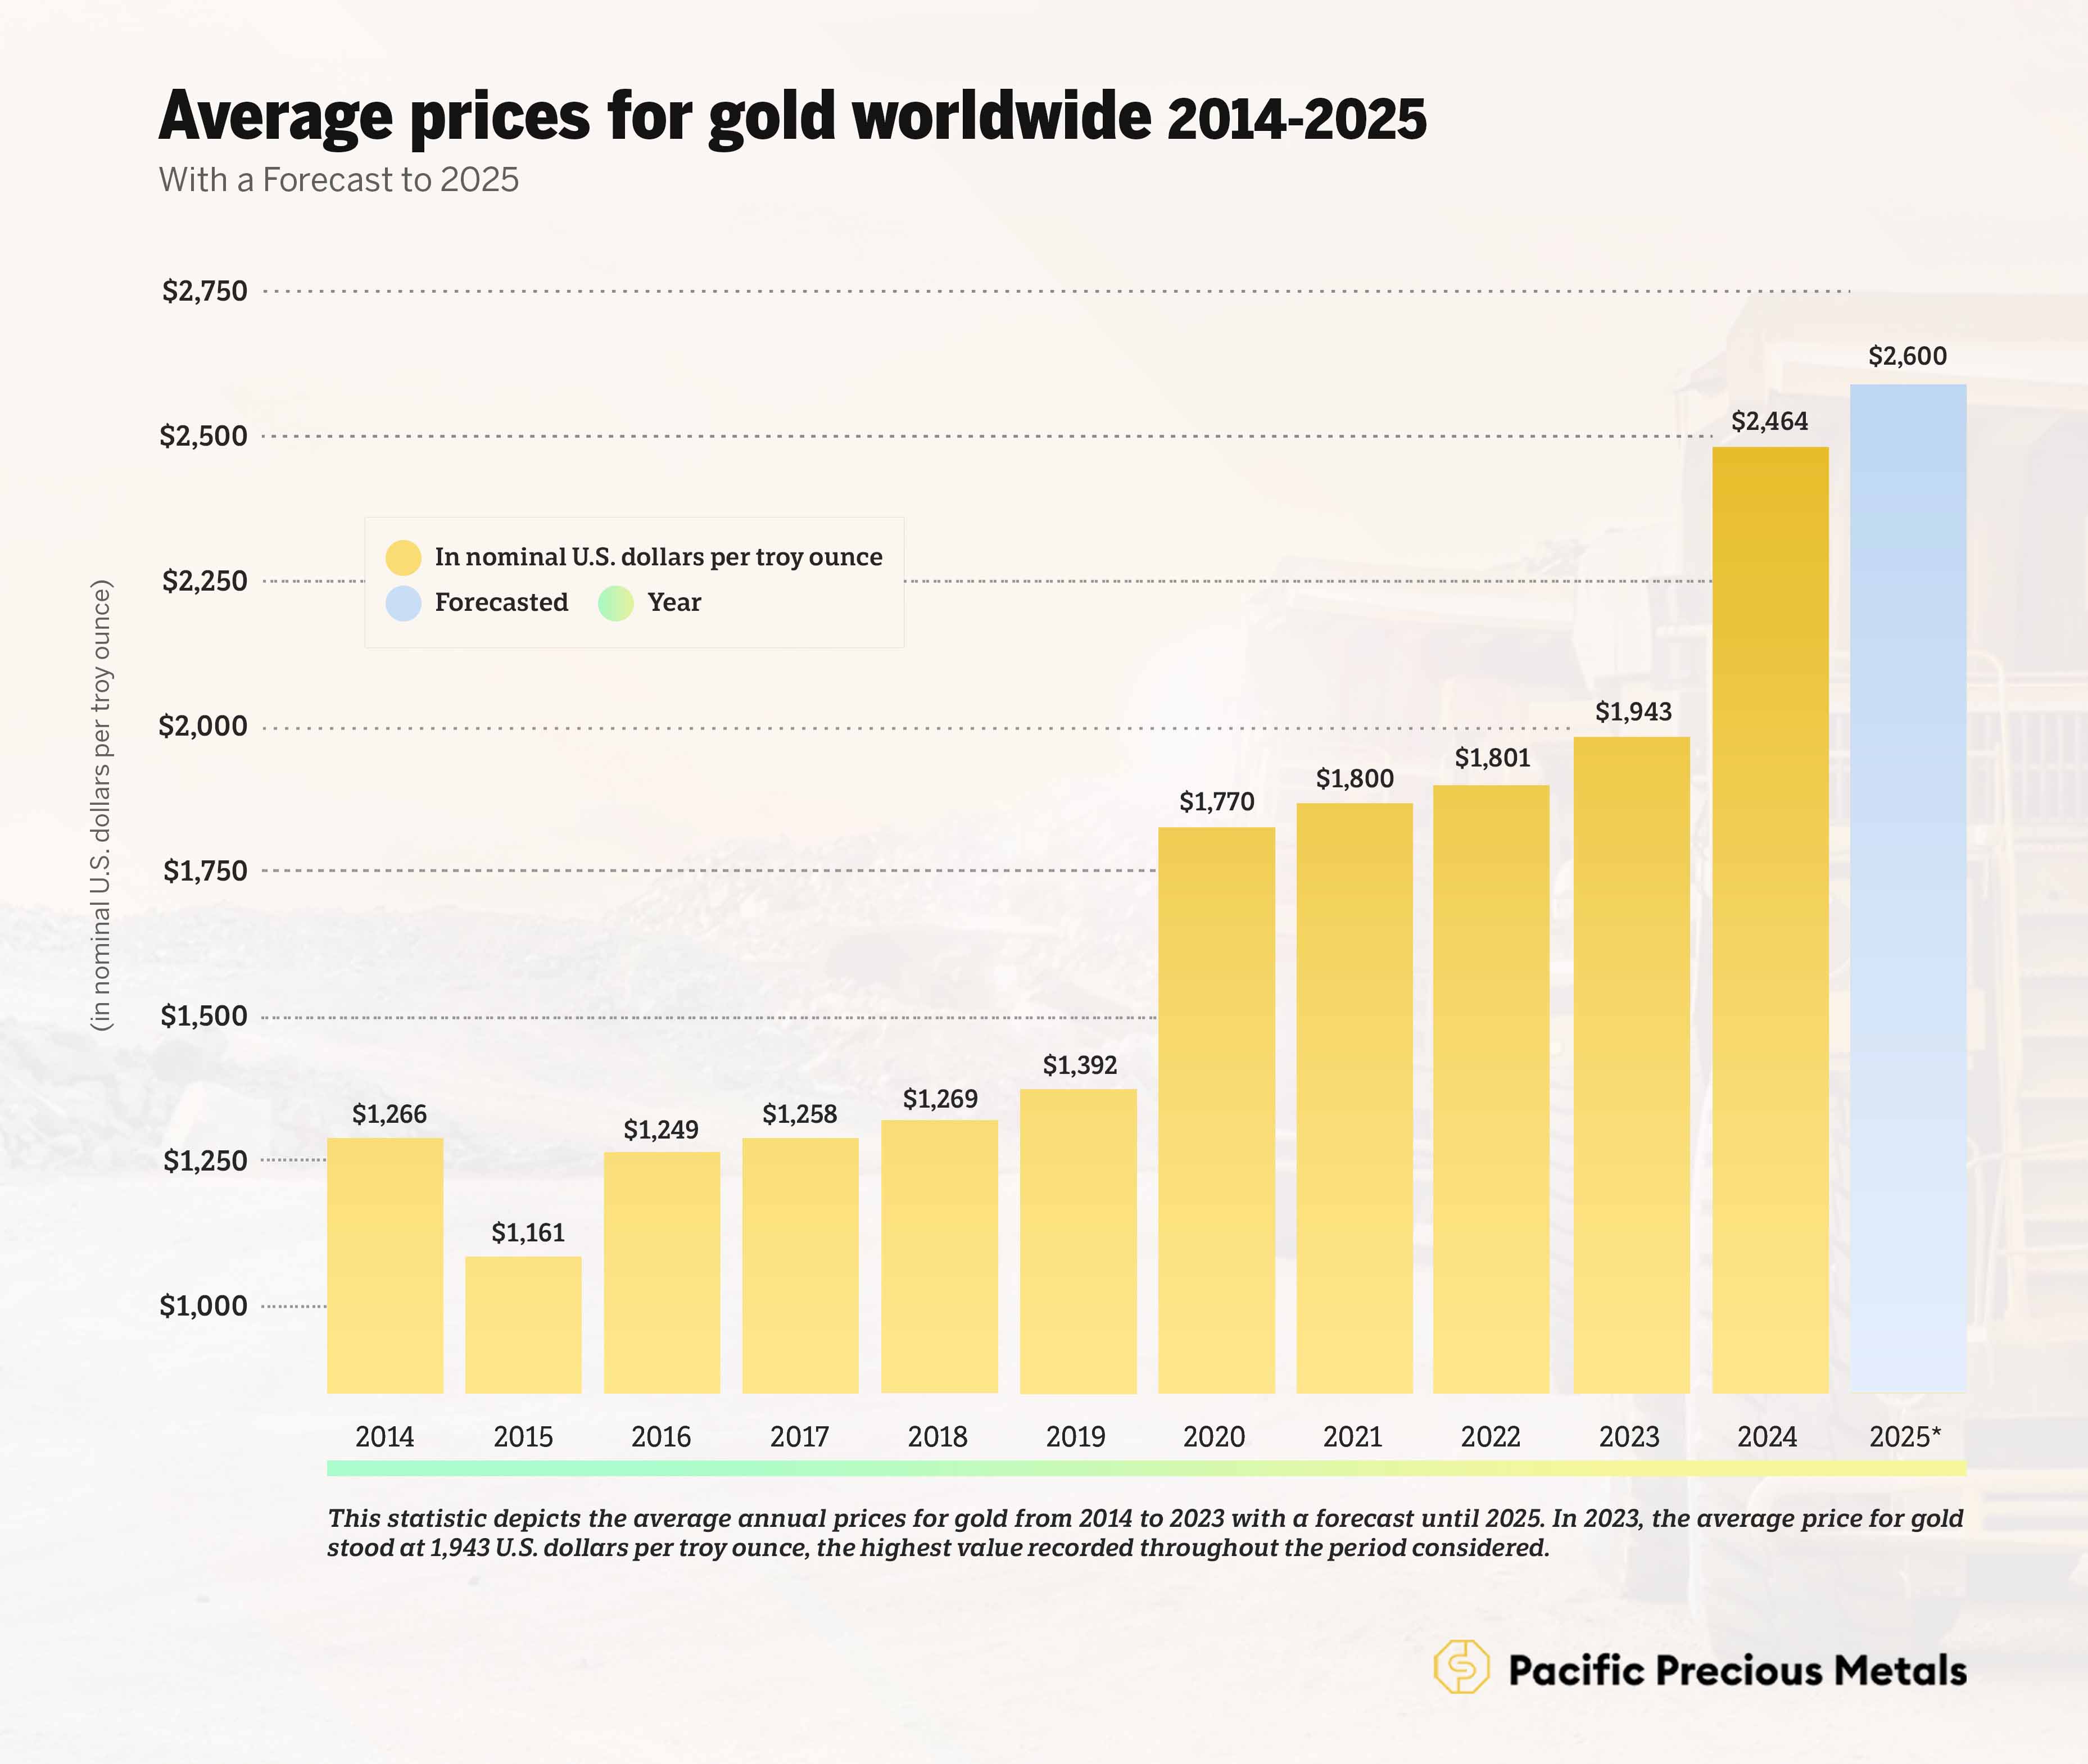
- Gold prices have risen steadily, peaking at $2,464 per troy ounce in 2024.
- A notable increase occurred between 2019 and 2020, when prices jumped from $1,392 to $1,770.
- The forecast suggests a sustained upward trajectory, with the price reaching $2,600 in 2025.
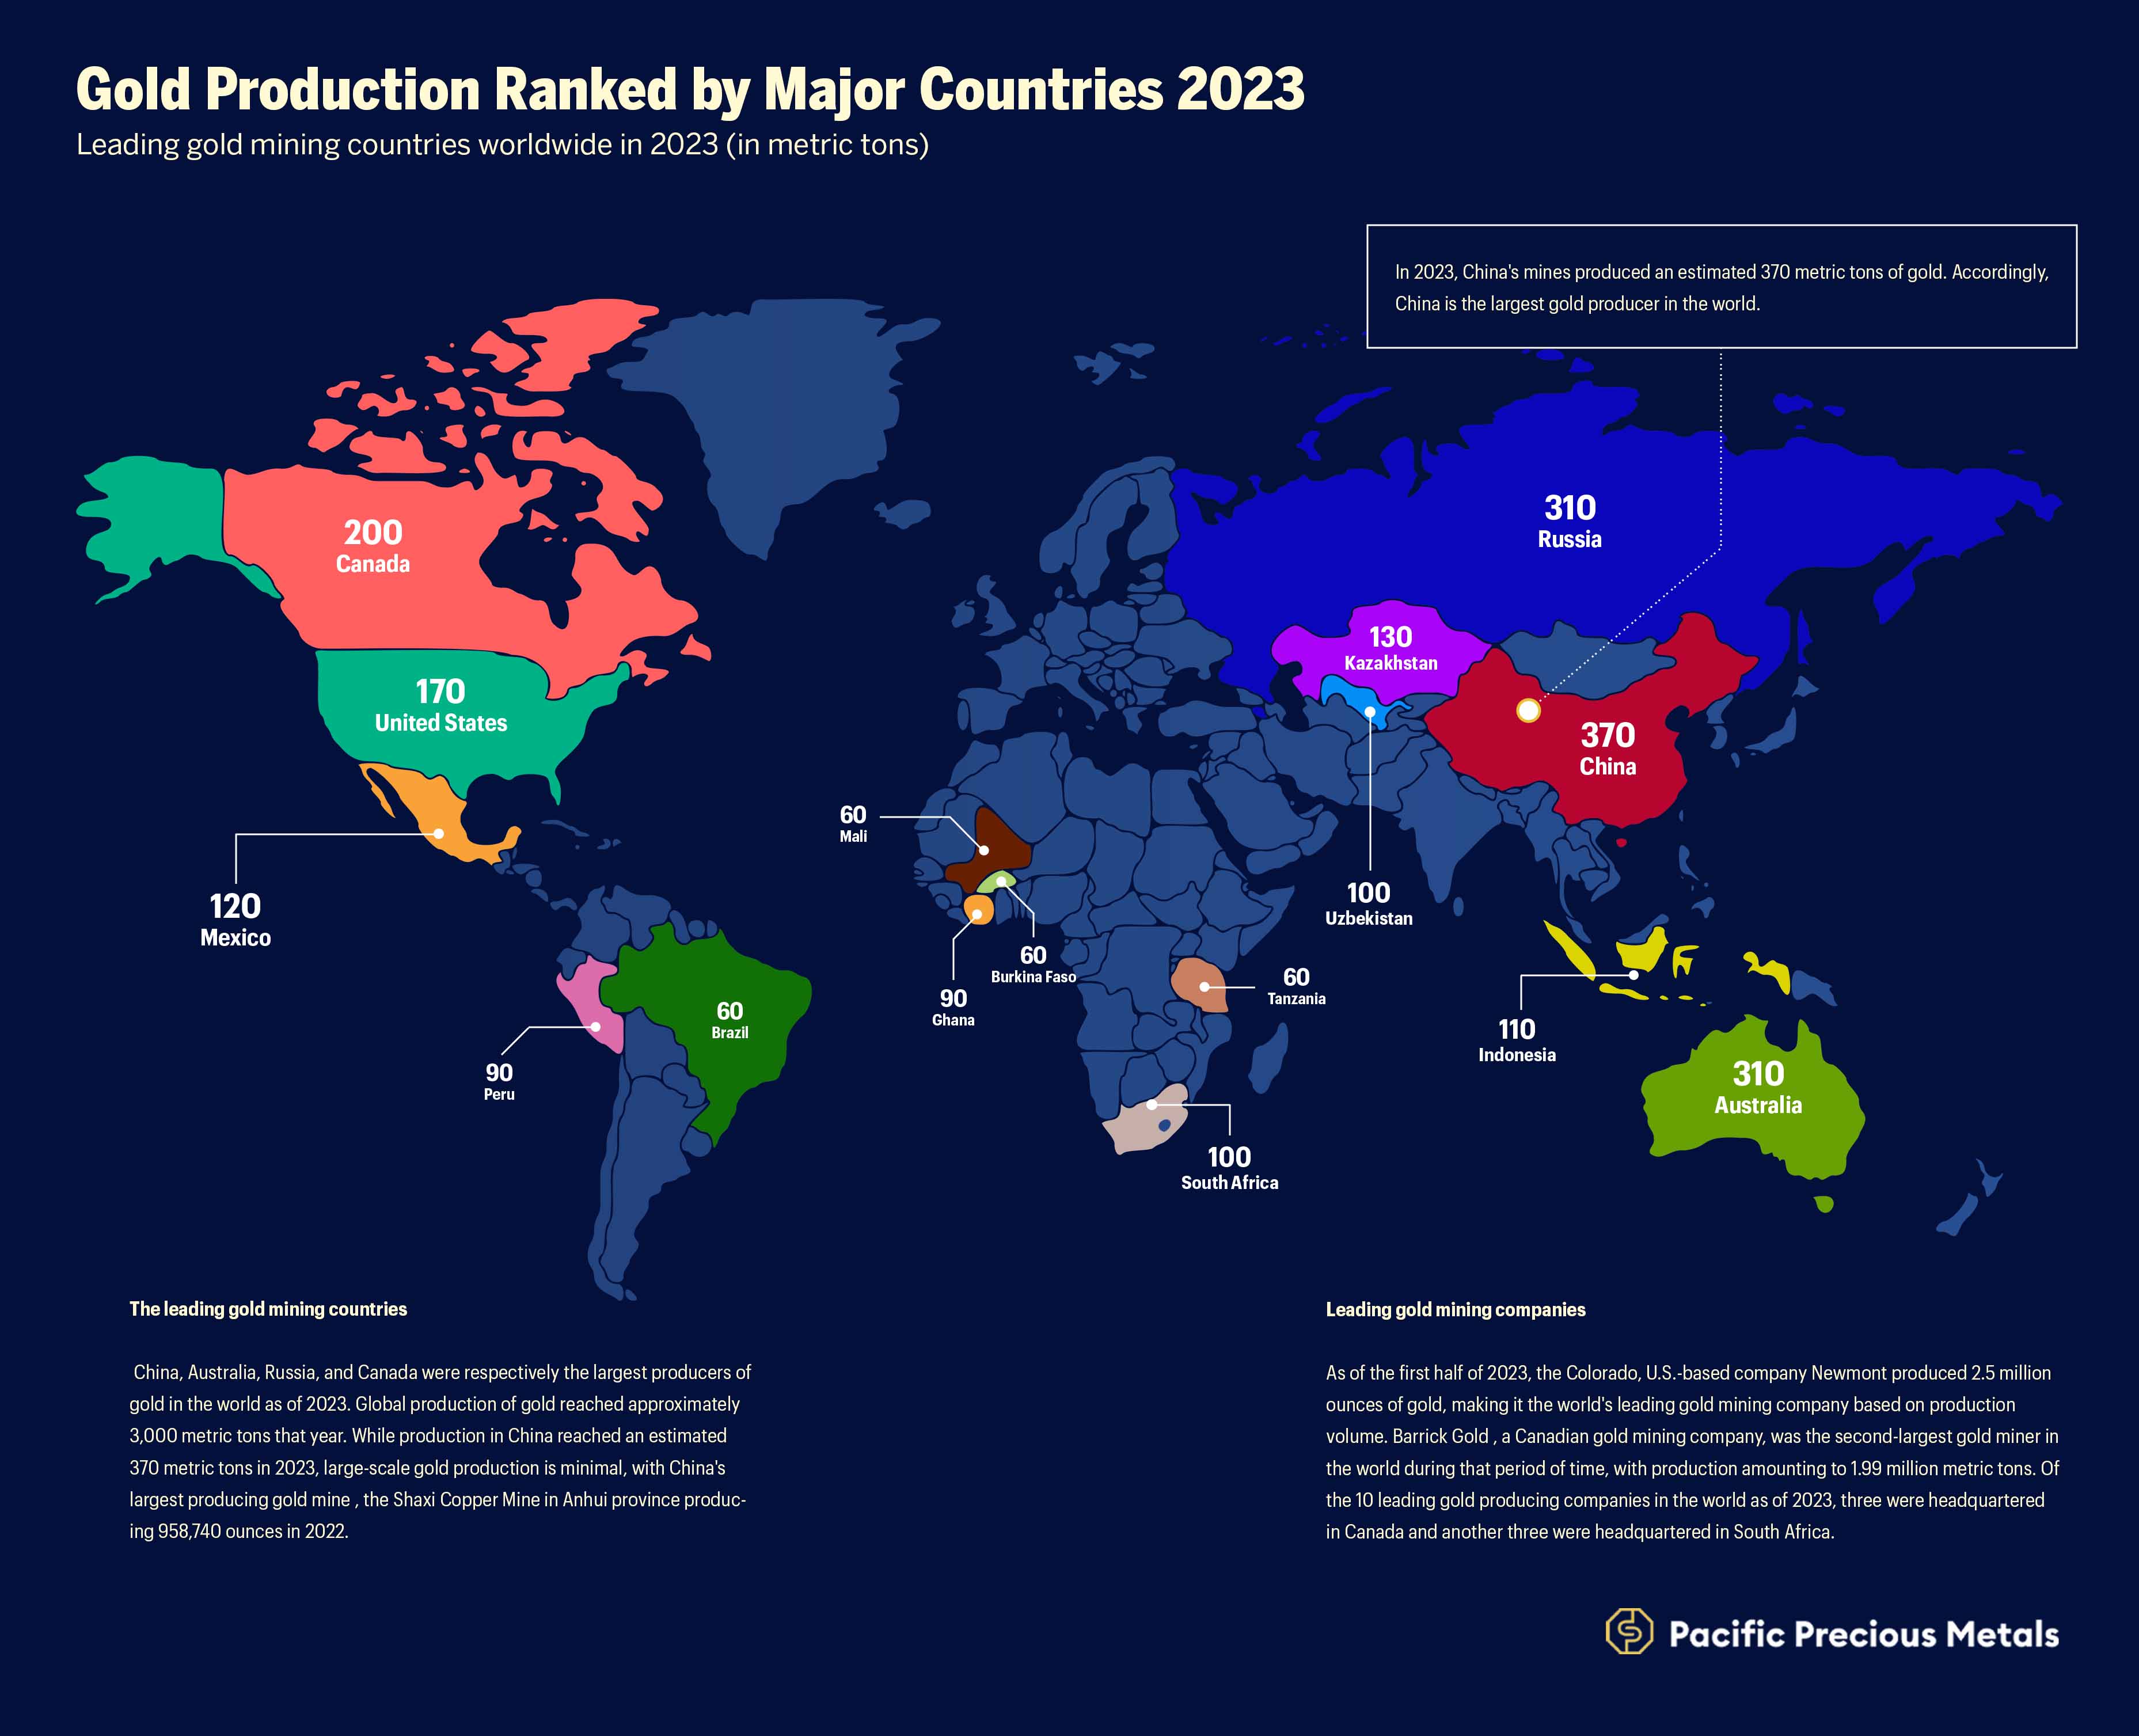
Leading Gold Mining Countries:
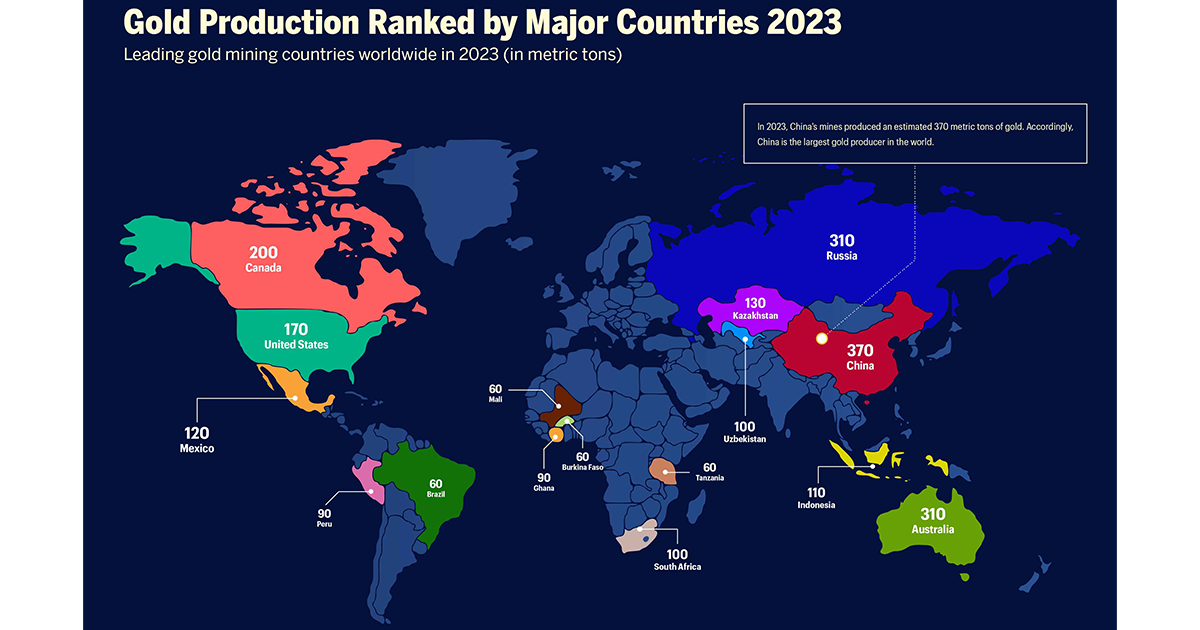
- China is at the top, producing 370 metric tons of gold in 2023.
- Australia and Russia both produced 310 metric tons each, sharing the second spot.
- Canada and the United States follow with 200 and 170 metric tons, respectively.
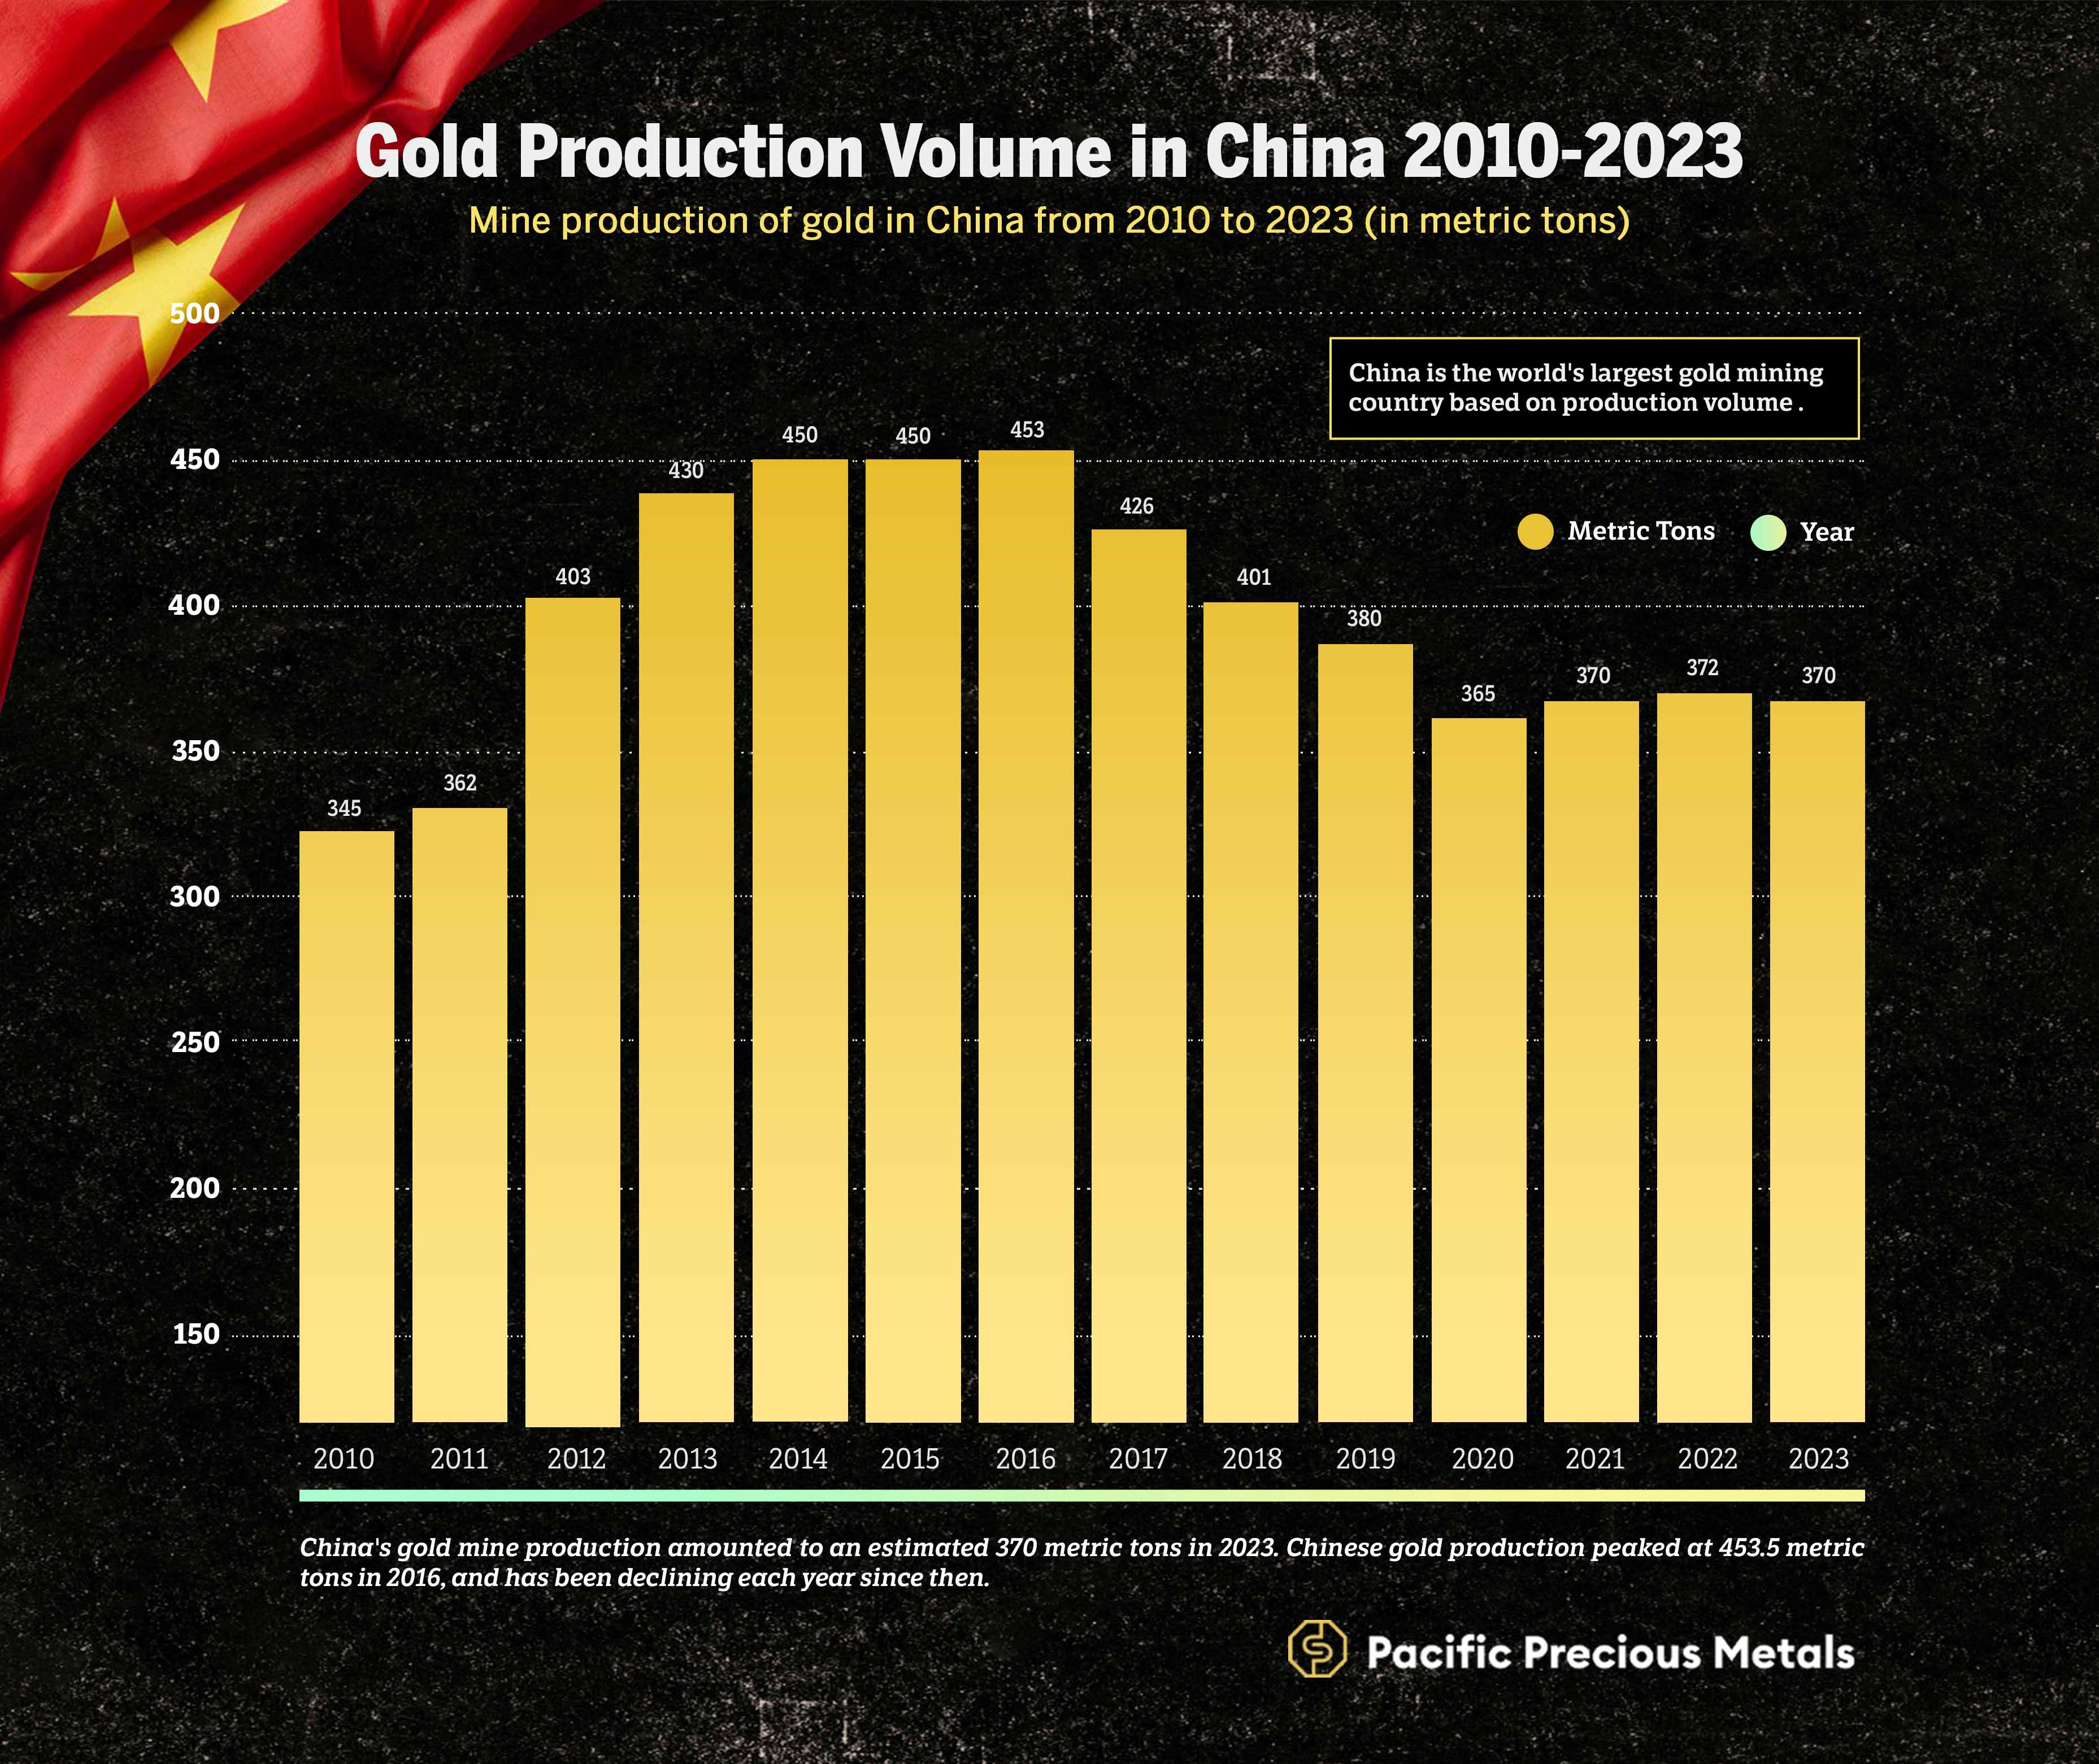
Gold Production in China:
- China's gold production peaked at 453 metric tons in 2016.
- Since 2016, there has been a slight decline, with 370 metric tons produced in 2023.
- The production remained relatively stable between 2020 and 2023, averaging around 370 metric tons.
Distribution of Gold Demand Worldwide:
- Jewelry (48.74%) accounts for the majority of global gold demand, followed by investment (23.32%), central banks (21.25%), and technology (6.69
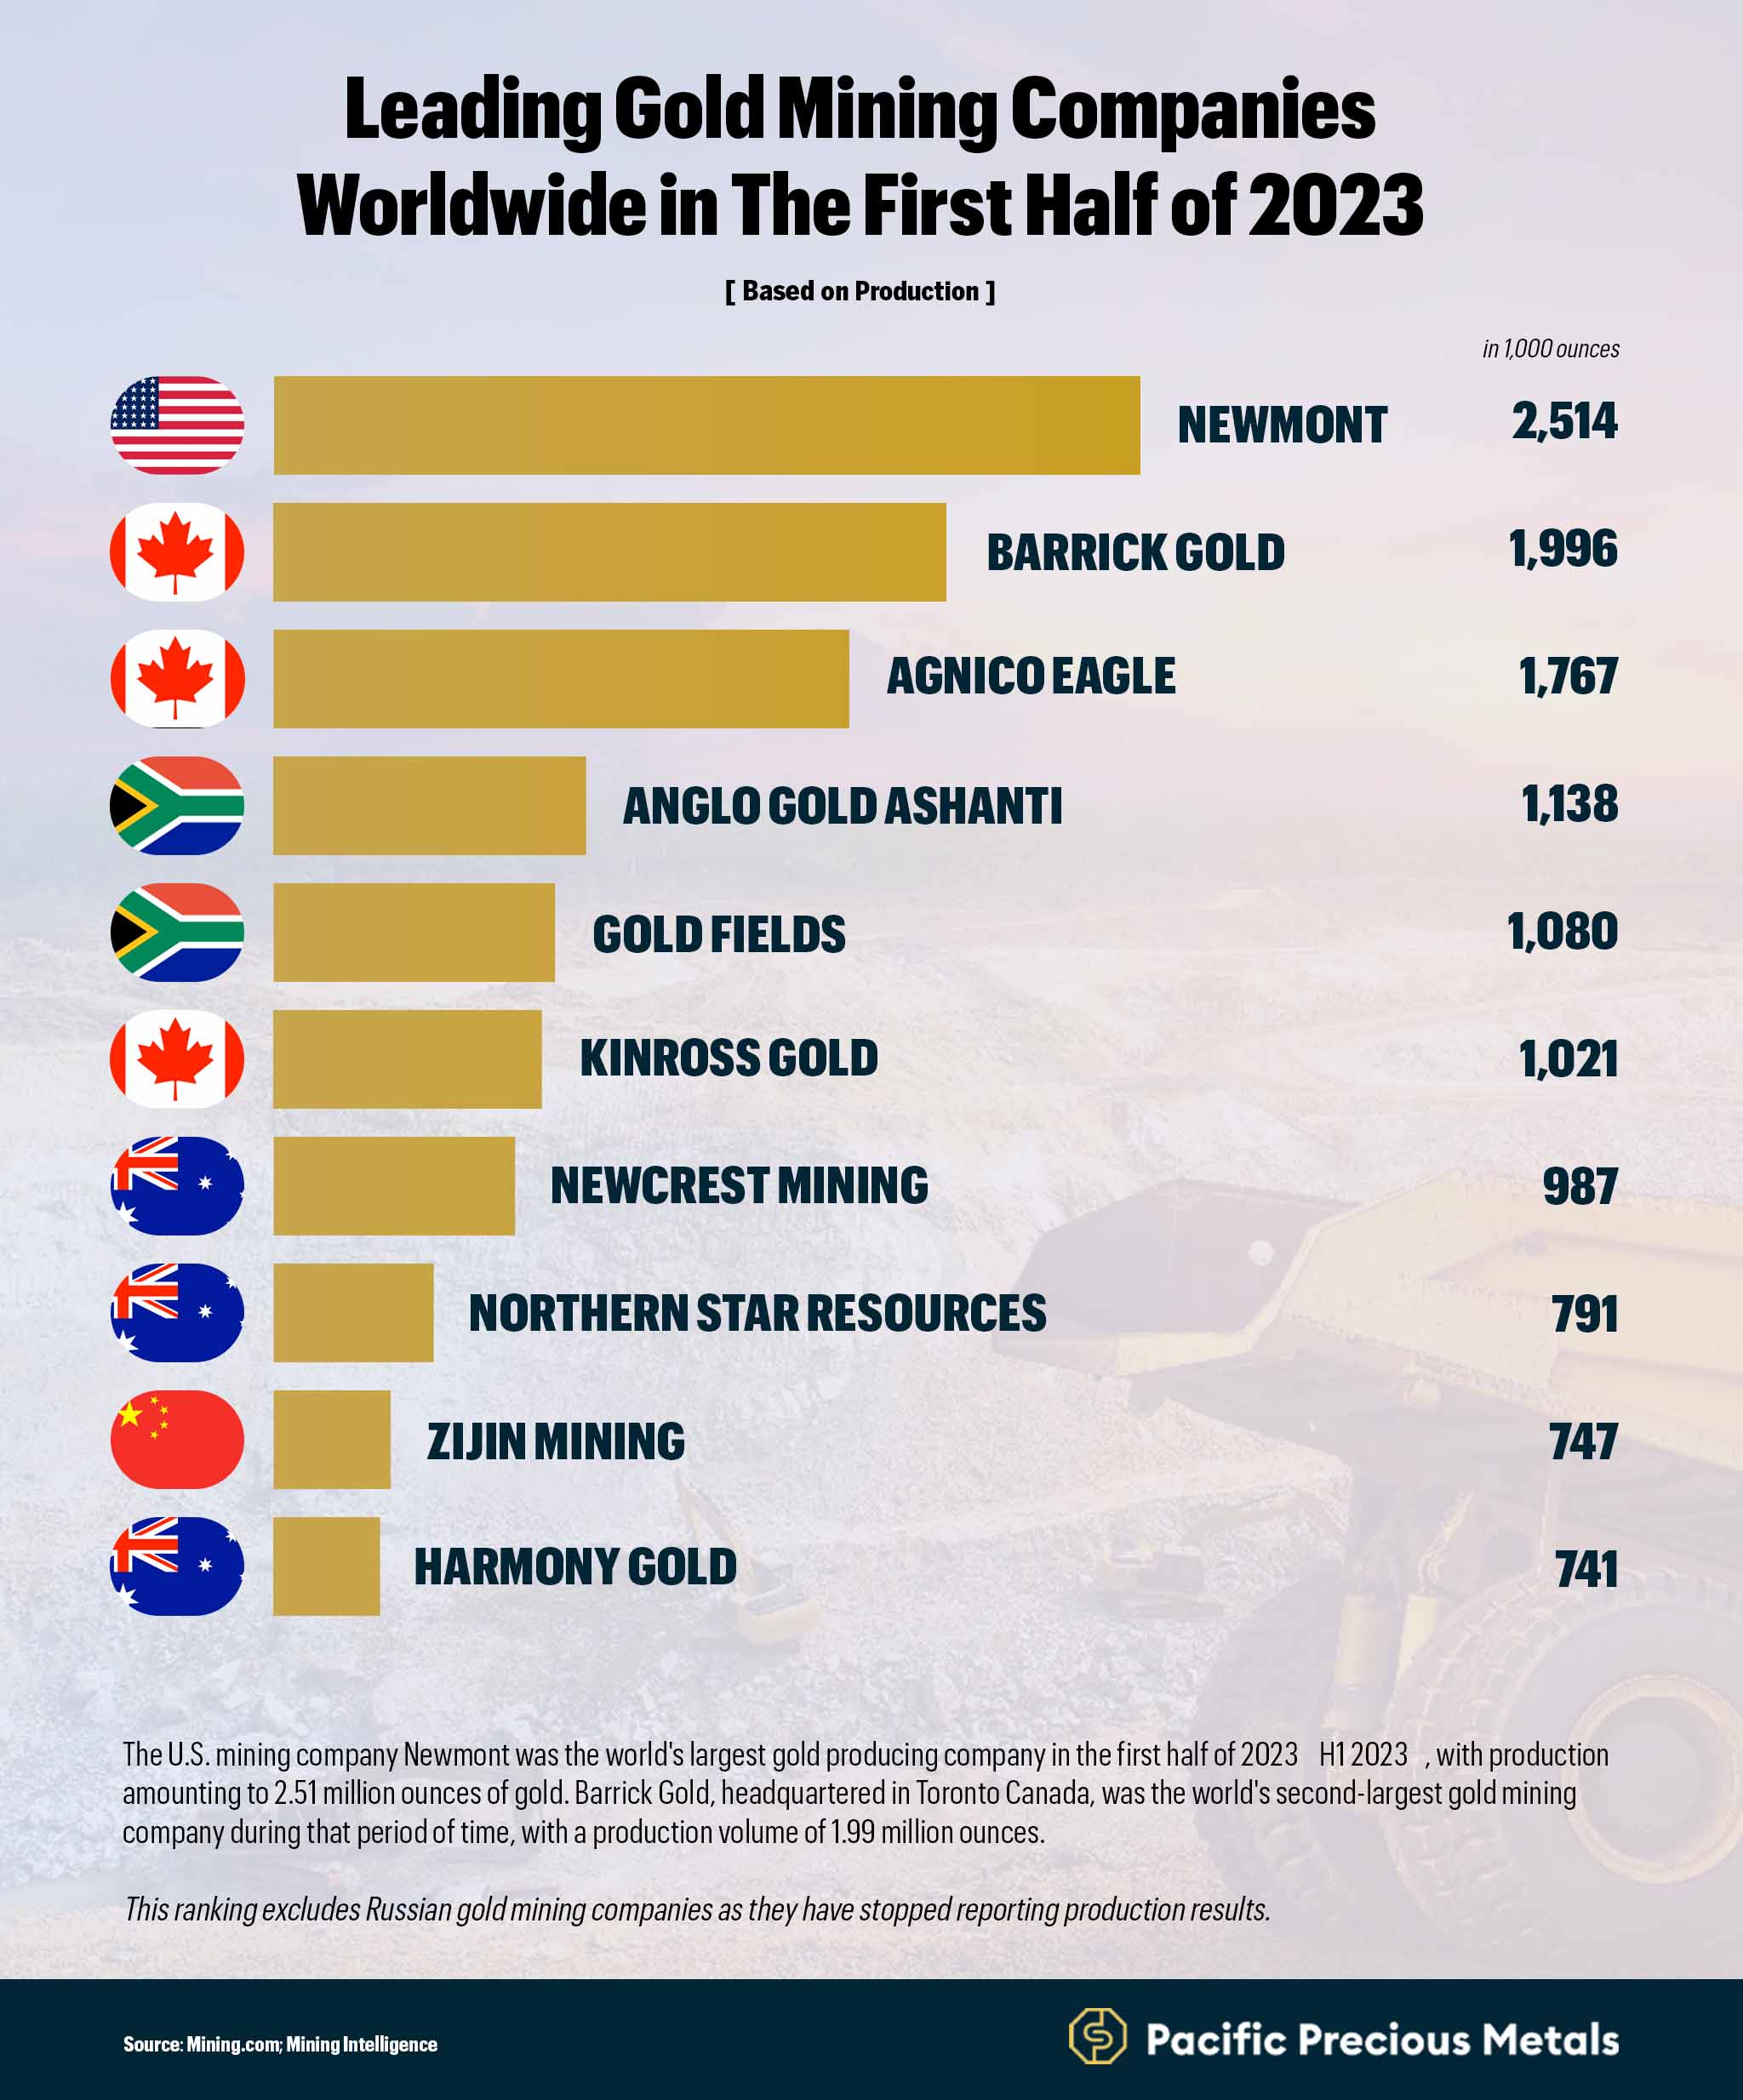
Leading Gold Mining Companies:
- Newmont (U.S.) leads in production with 2,514 koz, followed by Barrick Gold (Canada) with 1,996 koz, and Agnico Eagle (Canada) with 1,767 koz.
Leading Mining Companies
- BHP (Australia) is the largest mining company with a market capitalization of $145.86 billion, followed by Rio Tinto (UK) at $120.37 billion, and Southern Copper Corp (U.S.) at $89.89 billion.
Mine Reserves of Gold Worldwide as of 2023
Countries with the Largest Gold Mine Reserves
Australia, Russia, South Africa, the United States, and China are home to the largest gold mine reserves worldwide. The importance of these reserves extends beyond national economic well-being and geopolitical strategies, shaping the dynamics of the entire global landscape.
1. Australia - 12,000 metric tons
Australia holds the largest gold deposits in the world at 12,000 metric tons. These vast reserves are primarily concentrated in Western Australia, with major mining areas including Kalgoorlie, the Super Pit, and the Boddington Gold Mine. Two of the biggest mining companies in the world, BHP (headquartered in Melbourne) and Rio Tinto, have several mines across Australia, the second-largest gold producer after China. The country's position as a leading gold producer provides significant economic benefits, contributing to employment, export revenues, and regional development.
2. Russia - 11,100 metric tons
Russia has the second-largest gold mine reserves, at 11,100 metric tons. Russian gold mining is primarily conducted by state-controlled and private companies in Siberia and the Far East. The biggest gold mine in Russia, Olimpiada, is operated by Polyus, the largest gold-producing company in the country. Ranking third globally in gold production, Russia is actively diversifying its economy beyond oil and gas to strengthen its geopolitical position amidst international sanctions and economic pressures.
3. South Africa - 5,000 metric tons
South Africa, currently holding the third-largest reserve of gold mine deposits globally, has a rich history of gold mining. It was the world's leading gold producer until 2006. However, its production has since slipped to ninth place. Notably, Gold Field's South Deep mine, located in the Witwatersrand Basin, was built to extract one of the largest known gold deposits in the world.
4. United States - 3,000 metric tons
The US gold mining industry dates back to the 19th-century Gold Rush era. Today, it is the world's fifth-largest gold producer, with operations in Nevada, Alaska, and Colorado. The US has a gold mine reserve of 3,000 metric tons. Major mines include the Carlin Trend, one of the richest gold mining areas in the world. The gold mining industry supports thousands of jobs and generates substantial revenue through modern practices that focus on efficiency and environmental concerns.
5. China - 3,000 metric tons
China also holds gold reserves of 3,000 metric tons, with major mining areas in Shandong, Henan, and Fujian provinces. As both the largest producer and consumer of gold, China has a significant influence on global gold markets. The Chinese government actively supports gold mining to diversify its economic resources.
Strategic Importance of Gold Reserves
Gold reserves have immense geopolitical and economic implications.
Large gold reserves provide a cushion against economic shocks and currency devaluation. They contribute to national wealth and can be used to support monetary policies. Countries can also use gold reserves to attract foreign investment and stabilize their currencies during financial crises.
Gold reserves also enhance a country's influence on the global stage, providing leverage in trade negotiations and economic diplomacy. Countries with substantial gold reserves can exert greater control over global gold markets, affecting supply and demand dynamics. Furthermore, gold reserves can be a strategic asset in times of geopolitical tension, offering financial security and economic resilience.
Average Prices for Gold Worldwide
Price Trends for Gold Over the Past Decade:
Gold prices climbed steadily over the past decade, increasing from $1,266 per troy ounce in 2014 to $1,943 in 2023 – a 53.5% surge. While 2015 and 2016 saw dips, prices rebounded strongly.
During the COVID-19 pandemic in 2020, investors flocked to gold as a safe-haven asset as it was a time of economic uncertainty. This increased demand drove up prices, evident in the notable rise to $1,770 per troy ounce in 2020. Building on this momentum, gold prices surged to $2,464 by 2024. This upward trajectory is projected to continue, with forecasts predicting the price to reach $2,600 in 2025.
Leading Gold Mining Countries Worldwide
Gold Production Around the World:
For centuries, gold production was dominated by a select few. Until the 1900s, the US, Australia, and Russia held the top spots. Then, South Africa burst onto the scene after unearthing a massive gold reserve in the Witwatersrand Basin.
Today, over 40 countries contribute to global gold production. China alone was the largest producer in the world in 2023. Following closely behind are Australia, Russia, and Canada, each playing a key role in shaping the world's gold supply.
1. China - 370 metric tons
China is the largest gold producer globally. Gold production in China in 2023 was 370 metric tons. State-owned companies dominate the gold mining sector and Shaxi Copper Mine is the largest gold mine in the country. China's gold production is vital for meeting domestic demand, as the country is also one of the largest consumers of gold.
2. Australia - 310 metric tons
Australia is tied with Russia as the second-largest gold producer. The country's vast gold reserves and high-grade ore deposits make it a key supplier. Western Australia is the top mining state, and Australia exports gold to over 55 countries.
3. Russia - 310 metric tons
Russia's gold production has been on a steady climb for the past decade, reaching a milestone in 2023 with an output of 310 metric tons. Russia's significant gold production supports both its domestic economy and global supply. The country’s gold mining industry is strategically important, especially amid geopolitical tensions.
4. Canada - 200 metric tons
Canada's gold mining industry is experiencing a golden age, with production reaching 200 metric tons in 2023. Most of this production is concentrated in Ontario and Quebec.
5. United States - 170 metric tons
The US produced an estimated 170 metric tons of gold in 2023. The country’s gold production is centered in Nevada and Alaska. Of them, Nevada has seven of the top ten largest gold mines in the country.
Production of Gold in China (2010-2023)
Analysis of China's Gold Production Trends
China's gold production has experienced fluctuations over the past decade, owing to various economic, regulatory, and market factors.
Period of Growth (2010-2016):
From 2010 to 2016, China's gold production saw a consistent upward trend, growing from 345 metric tons to 453 metric tons.
- China's rapid economic growth during this period increased demand for gold in both domestic markets and industrial applications.
- Significant investments in mining technology and infrastructure improved extraction efficiency and capacity.
- Favorable government policies and incentives supported the expansion of the mining sector.
Period of Decline (2016-2020):
Production peaked at 453 metric tons in 2016 and then began to decline, reaching 365 metric tons by 2020.
- A slowdown in China's economic growth and a shift towards more sustainable development practices impacted the mining industry.
- Stricter environmental regulations and enforcement led to the closure of many small and inefficient mines, reducing overall production capacity.
- Depletion of easily accessible gold reserves necessitated more expensive and challenging mining operations.
Period of Stability (2021-2023):
Production stabilized around 370 metric tons from 2021 to 2023, with minor fluctuations.
- Continued improvements in mining technology and methods helped stabilize production levels.
- A more balanced approach to environmental regulations allowed for sustainable mining practices without severely impacting production.
- Steady domestic and international demand for gold supported consistent production levels.
China's Position in the Global Gold Market
China, the world's leading gold producer since 2007, most recently contributed to a significant global output in 2023. Conversely, China is also one of the biggest consumers of gold. Notably, the People's Bank of China has one of the highest gold reserves.
Largest Gold Producer
As of 2023, China remains the world's largest gold producer, with an estimated production of 370 metric tons. China's investment in modern mining technologies and infrastructure has enabled it to maintain high production levels despite challenges such as resource depletion and stricter environmental regulations.
Major Gold Consumer
China is one of the world's largest markets for gold jewelry, driven by cultural preferences and the tradition of gold gifting during festivals and weddings. Meanwhile, Chinese investors view gold as a safe-haven asset, particularly during periods of economic uncertainty or market volatility. This has led to a robust demand for gold bars, coins, and ETFs (Exchange-Traded Funds) backed by gold. Gold is also used in various industrial applications, including electronics and technology, contributing to steady domestic consumption.
Influence on Global Prices
As both a top producer and consumer, China significantly influences global gold prices. High domestic demand coupled with robust production can stabilize prices, while shifts in Chinese demand or production can lead to price volatility.
Geopolitical and Economic Strategies
The Chinese government strategically accumulates gold reserves as part of its economic policy to diversify reserves away from the US dollar and enhance economic stability. Furthermore, through the Belt and Road Initiative (BRI), China invests in mining projects across Asia, Africa, and other regions, securing access to additional gold resources and strengthening its influence over global gold supply chains.
Environmental and Regulatory Landscape
China's recent focus on sustainable development has led to stricter environmental regulations in the mining sector. Changes in mining policies and environmental regulations in China can have ripple effects on global gold supply, influencing production costs and output levels.
Distribution of Gold Demand Worldwide in 2023
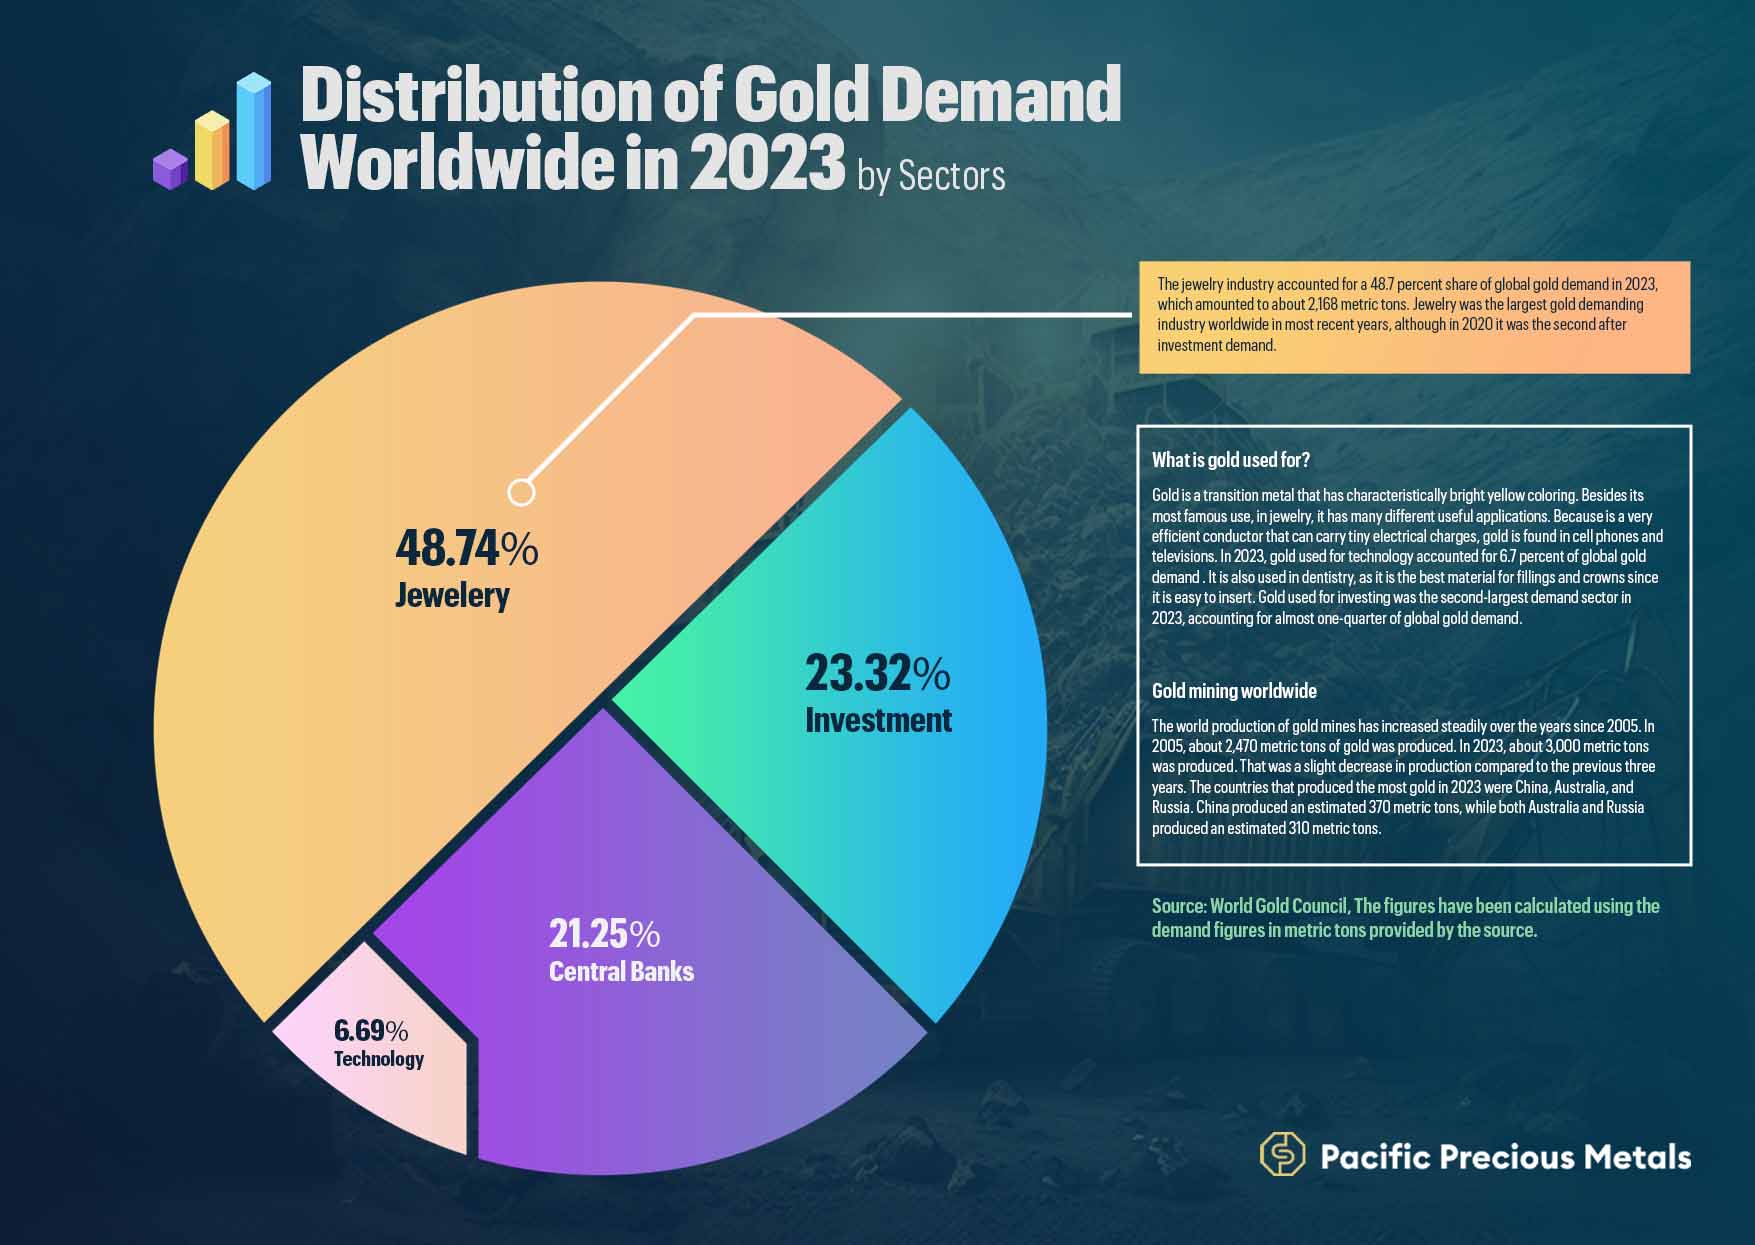
In 2023, the global demand for gold was distributed across four key sectors: jewelry (48.74%), investment (23.32%), central banks (21.25%), and technology (6.69%). Each sector's demand is driven by distinct factors that reflect broader economic, cultural, and technological trends.
1. Jewelry - 48.74%
Jewelry remains the most important driver of gold demand, thanks to its cultural significance, rising incomes, and changing fashion trends.
- Cultural Significance: In many cultures, particularly in countries like India and China, gold jewelry holds significant cultural and traditional importance. It is commonly used in weddings, festivals, and other ceremonial occasions.
- Economic Prosperity: Rising incomes and economic growth in emerging markets increase disposable income, which is often spent on luxury goods like gold jewelry.
- Fashion Trends: Changing fashion trends and the popularity of gold as a luxury item contribute to its demand.
- Investment Appeal: Gold jewelry is also seen as a form of investment, providing both aesthetic value and financial security.
2. Investment - 23.32%
The demand for gold investments is driven by a number of factors, including inflation concerns, a desire for portfolio diversification, and economic uncertainty.
- Economic Uncertainty: Gold is widely regarded as a safe-haven asset. During times of economic uncertainty, geopolitical tensions, or market volatility, investors flock to gold to protect their wealth.
- Inflation Hedge: With rising concerns about inflation, investors turn to gold as a hedge against currency devaluation. This is particularly relevant during periods of expansive monetary policies and low interest rates.
- Diversification: Investors seek to diversify their portfolios to reduce risk. Gold's low correlation with other financial assets makes it an attractive option for portfolio diversification.
- Physical and Digital Gold: The growth of digital gold investment platforms has made it easier for retail investors to buy and sell gold, further driving demand.
3. Central Banks - 21.25%
Central banks accumulate gold to diversify their foreign exchange reserves, ensure economic stability, and strengthen geopolitical positioning.
- Reserve Diversification: Central banks around the world accumulate gold to diversify their foreign exchange reserves. This reduces dependency on any single currency, particularly the US dollar.
- Economic Stability: Gold is used by central banks as a means of ensuring economic stability and building trust in their financial systems, as it acts as a safeguard against economic crises and currency fluctuations.
- Geopolitical Strategy: In some cases, central banks increase their gold reserves to strengthen their geopolitical positioning. This is particularly true for countries facing international sanctions or economic pressures.
- Long-term Value Preservation: Central banks view gold as a long-term store of value, contributing to steady demand irrespective of short-term market conditions.
4. Technology - 6.69%
Gold's unique properties make it indispensable in various technological applications.
- Electronics: Gold's excellent conductivity and resistance to corrosion make it essential in the electronics industry. It is used in components such as circuit boards, connectors, switches, and relays.
- Medical Devices: Gold is utilized in medical devices and equipment, including diagnostic tools and treatments. Its biocompatibility and resistance to bacteria make it valuable in this sector.
- Renewable Energy: Innovations in renewable energy technologies, such as solar panels, use gold in their production processes. The growth of green technologies continues to drive demand in this area.
- Aerospace and Engineering: Gold is used in aerospace and engineering applications for its reliability and durability under extreme conditions, contributing to steady demand from these industries.
Leading Gold Mining Companies Worldwide (First Half of 2023)
Overview of Leading Gold Mining Companies
Here's a brief overview of each company:
1. Newmont (U.S.)
Production: 2,514,000 troy ounces
Newmont is the largest gold mining company globally, headquartered in the United States. The company's world-class portfolio of assets, prospects, and talent is based in favorable mining countries such as Africa, Australia, Latin America and the Caribbean, North America, and Papua New Guinea. Newmont was established in 1921 and has been publicly traded since 1925.Newmont (U.S.)
2. Barrick Gold (Canada)
Production: 1,996,000 troy ounces
Barrick Gold, based in Canada, is a prominent gold mining company with operations in North America, South America, Africa, and Australia. Known for its large-scale mining operations and robust project pipeline, Barrick Gold plays a crucial role in global gold production.
3. Agnico Eagle (Canada)
Production: 1,769,000 troy ounces
Agnico Eagle, headquartered in Canada, focuses on mining operations primarily in Canada, Finland, and Mexico. The company, founded in 1957, is recognized for its sustainable mining practices and operational excellence.
4. AngloGold Ashanti (South Africa)
Production: 1,138,000 troy ounces
AngloGold Ashanti, headquartered in Denver, US, operates mines in Africa, the Americas, and Australia. Known for its deep-level mining expertise and substantial gold reserves in key mining regions, it's one of the world's largest gold producers.
5. Gold Fields (South Africa)
Production: 1,080,000 troy ounces
Gold Fields, headquartered in South Africa, is a diversified gold producer with nine operational mines in Australia, South Africa, Ghana, Chile, and Peru, and one project in Canada. The company focuses on sustainable mining practices and community engagement while maintaining a strong presence in the global gold market.
6. Kinross Gold (Canada)
Production: 1,021,000 troy ounces
Founded in 1993, Kinross Gold is a leading gold mining business with operations and projects in the United States, Canada, Brazil, Chile, and Mauritania. Based in Toronto, Canada, the company is committed to producing value via operational excellence, balance sheet strength, controlled expansion, and responsible mining.
7. Newcrest Mining (Australia)
Production: 987,000 troy ounces
Newcrest Mining, headquartered in Australia, operates mines in Australia, Papua New Guinea, and Canada. It is the largest gold producer listed on the Australian Securities Exchange and one of the world's largest gold miners. The company focuses on high-margin, long-life assets and exploration to sustain production growth and enhance shareholder value.
8. Northern Star Resources (Australia)
Production: 791,000 troy ounces
Northern Star Resources, also based in Australia, operates mines in Australia and North America. The company is known for its strong operational performance and growth strategy, aiming to expand its resource base through exploration and acquisitions.
9. Zijin Mining (China)
Production: 747,000 troy ounces
Zijin Mining, headquartered in China, operates mines primarily in China and overseas, including Australia, Serbia, and Papua New Guinea. As one of China's leading gold producers, Zijin Mining plays a significant role in both domestic and global gold markets.
10. Harmony Gold (South Africa)
Production: 741,000 troy ounces
Harmony Gold, based in South Africa, operates mines in South Africa and Papua New Guinea. The company focuses on profitable growth, sustainability, and responsible mining practices, contributing to South Africa's gold mining sector.
Leading Mining Companies Worldwide Based on Market Capitalization 2024
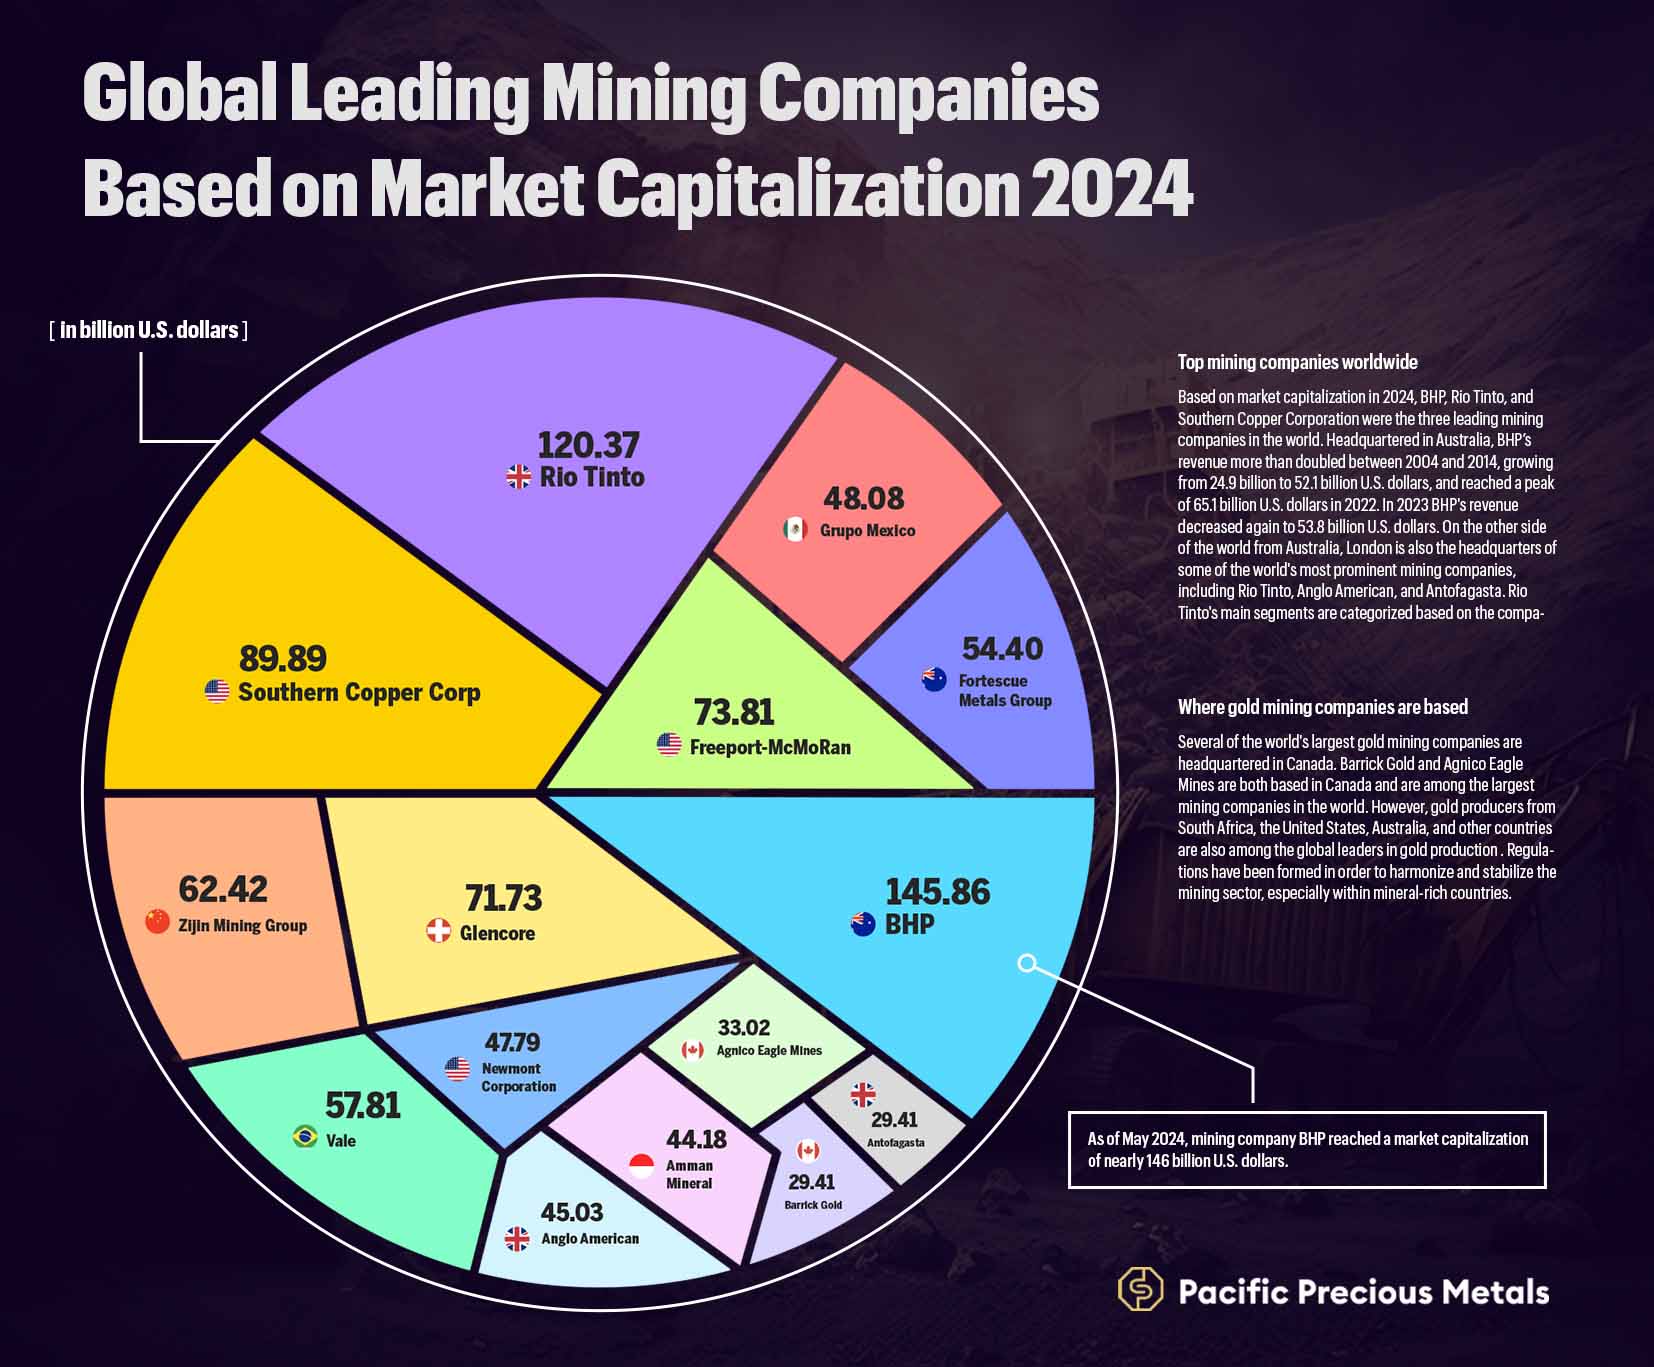
Leading the charge in the global mining industry, these companies, ranked by market capitalization as of May 2024, are crucial to supplying the world with essential resources and driving economic progress:
The largest mining company globally, BHP (Australia) has a diversified portfolio including iron ore, copper, oil, and gas, with a market capitalization of $145.86 billion. With a market cap of $120.37 billion, Rio Tinto (UK) operates in sectors like aluminum, copper, diamonds, and iron ore, known for its sustainable development and innovation. Valued at $89.89 billion, Southern Copper Corp (U.S.) is one of the world's largest copper producers with operations in Peru and Mexico. With a $73.81 billion market cap, Freeport-McMoRan (U.S.) has significant reserves of copper, gold, and molybdenum, especially in the Americas.
A leader in mining and commodity trading, Glencore (Switzerland) has a market capitalization of $71.73 billion. Valued at $62.42 billion, Zijin Mining Group (China) is a leading producer of gold and base metals with operations globally. With a market cap of $57.81 billion, Vale (Brazil) is a top producer of iron ore and nickel. Known for its iron ore production, Fortescue Metals Group (Australia) has a market cap of $54.4 billion. Valued at $48.08 billion, Grupo Mexico is a leading copper producer with operations in Mexico, Peru, and the U.S. Newmont Corporation (U.S.) is the largest gold mining company with a market cap of $47.79 billion, operating in the Americas, Australia, and Africa.
With a market capitalization of $45.03 billion, Anglo American (UK) is a diversified mining giant operating in diamonds, copper, platinum, and iron ore. Headquartered in Indonesia, Amman Mineral has a market capitalization of $44.18 billion. The company is a significant player in the copper and gold mining sectors, with major operations in Indonesia. Valued at $33.02 billion, Agnico Eagle Mines (Canada) focuses on gold mining operations in Canada, Finland, and Mexico. With a market capitalization of $29.41 billion, Barrick Gold (Canada) is one of the world's largest gold producers. The company operates in North America, South America, Africa, and Australia. Based in the UK and valued at $27.22 billion, Antofagasta (UK) is a significant copper producer with primary mining operations in Chile.
Conclusion
From national wealth to a hedge against uncertainty, gold is a crucial player in the global economy. Technological advancements and central bank strategies will continue to shape this ever-evolving market, ensuring gold's role in financial stability and geopolitical influence.
The article highlights the countries with the largest gold mine deposits worldwide and discusses the underlying economic and geopolitical implications associated with such large reserves of the precious metal.
The article also explains how the complex interplay of supply and demand, political developments, and economic changes has influenced gold price trends over time.
For investors, policymakers, and industry stakeholders, monitoring these trends is important as the gold industry remains a critical component of the global economy, offering stability and strategic advantages in an uncertain world.
Methodology:
This methodology outlines the approach taken to compile and analyze data on global gold mine reserves, production volumes, and leading gold mining companies. The primary sources of data include the US Geological Survey (USGS), the World Gold Council, and Mining Intelligence, supplemented by additional information from Mining.com.
By utilizing reliable sources and validating data through cross-referencing, the analysis offers accurate and detailed insights into the state of the global gold mining industry as of 2023. The study highlights Australia and Russia's significant contributions to gold reserves, identifies trends in production volumes and gold pricing over recent years, and so on.
Data Sources:
- US Geological Survey (USGS): Provided data on gold reserves and annual production volumes.
- World Gold Council: Offered insights into global gold mining trends, including production statistics and demand figures.
- Mining Intelligence: Supplied detailed information on gold mining companies and their production volumes.
- Mining.com: Contributed additional data on gold mining companies and global production rankings.
Analysis:
- Reserve and Production Comparison: The gold reserves of various countries were compared, highlighting Australia and Russia as having the largest reserves in 2023. This comparison included an analysis of their respective contributions to global gold reserves.
- Production Trends: Annual gold production volumes from 2005 to 2023 were analyzed to identify trends and significant changes in production levels. The analysis considered fluctuations in production volumes and compared production outputs of the top gold-producing countries.
- Gold Prices: The average annual prices of gold from 2014 to 2023 were plotted to observe trends and price fluctuations. The analysis included identifying factors that influenced gold prices during this period.
- Company Performance: Production volumes of leading gold mining companies were examined to determine their ranking and contribution to global gold production. Companies were evaluated based on their production volumes for the first half of 2023.
Data Validation:
- Cross-referencing: Data from different sources (USGS, World Gold Council, Mining Intelligence, Mining.com) were cross-referenced to ensure consistency and accuracy.
- Exclusion of Outliers: Russian gold mining companies were excluded from the global ranking analysis due to a lack of reported production data.